Satellite models.
Turning macro scenarios into risk parameters.
The link between GDP, unemployment, rates and house prices on one side, and default and loss rates on the other. For the EBA stress test, ICAAP and climate scenarios.
Statistically sound, and economically sensible.
Driver shortlist
Candidate macro variables per segment, matched to the scenario variables provided.
Specification
Transformations and lag structures searched by agents, ranked by fit and parsimony.
Economic plausibility
Sign constraints and sensitivity checks rule out models that fit but don't make sense.
Projection
Paths under each scenario, with the methodology's constraints applied.
What you need. And what happens if you don't have it.
| Data | Needed | If missing or incomplete |
|---|---|---|
| Default rate time series | Required · at least one full cycle | Pooled segments, with added conservatism |
| Macro history | Required | Public statistical series |
| Scenario paths | Required | Supervisory or internal scenarios |
| Segment and sector mapping | Required | Proposed by the agent for approval |
Every choice is a decision for a person. Every test has its threshold on the page.
Each comes with a recommended option, the reason and any data gap. The model owner approves the set at the design gate.
- Driver shortlistWhich macro variables may enter the model?
- Lag structureUp to how many quarters may a driver lead the default rate?
- Model sizeHow many drivers per model?
- Economic plausibilityAre sign constraints enforced?
- Out-of-sample testHow many recent quarters are held out?
- SegmentsWhich segments get their own model?
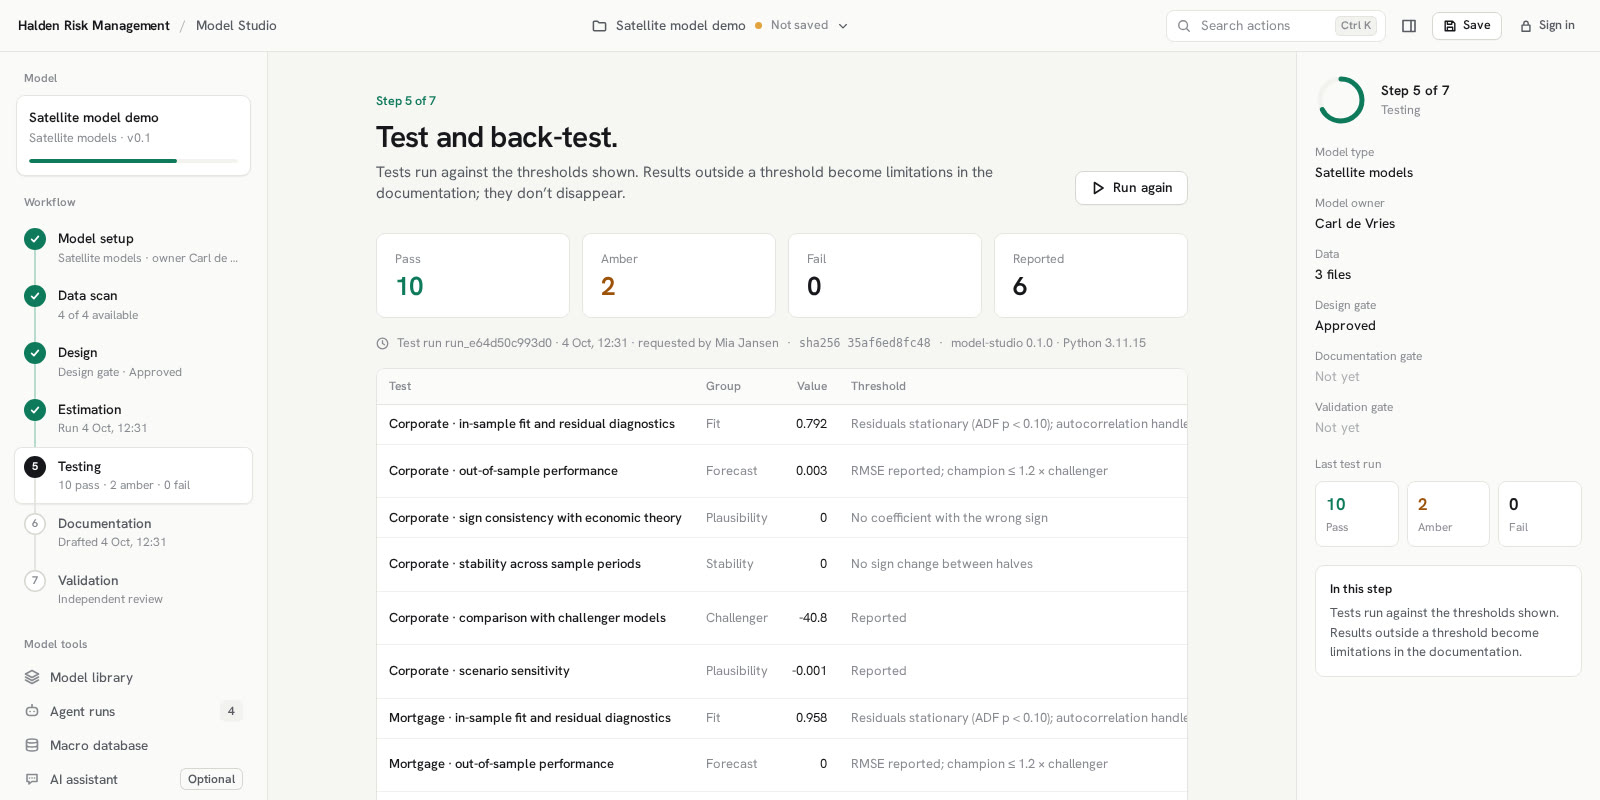
Shown next to each result. A test outside its threshold stays visible and becomes a limitation in the documentation.
| Test | Group | Threshold |
|---|---|---|
| In-sample fit and residual diagnostics | Fit | Residuals stationary (ADF p < 0.10); autocorrelation handled by HAC errors |
| Out-of-sample performance | Forecast | RMSE reported; champion ≤ 1.2 × challenger |
| Sign consistency with economic theory | Plausibility | No coefficient with the wrong sign |
| Stability across sample periods | Stability | No sign change between halves |
| Comparison with challenger models | Challenger | Reported |
| Scenario sensitivity | Plausibility | Reported |
Satellite models for 2027?
See them built on your data.
We'll walk through your use case and show the product on data structured like yours.