PD models.
Built from the defaults you can actually observe.
Rating and scorecard models for retail, SME and corporate portfolios, developed, calibrated and documented in Model Studio and designed around the EBA Guidelines on PD estimation.
Risk differentiation first. Then quantification, with conservatism made explicit.
Default definition & sample
Align to the EBA definition of default and build a representative development sample.
Risk differentiation
Agents shortlist drivers and test combinations for discriminatory power and stability.
Calibration
Calibrate to the long-run average default rate, with the economic cycle reflected.
Margin of conservatism
Identify data and method deficiencies, quantify each, and document the resulting margin.
What you need. And what happens if you don't have it.
| Data | Needed | If missing or incomplete |
|---|---|---|
| Default history | Required · at least five years | Ask us about shorter histories |
| Obligor characteristics | Required | — |
| Financial statements | Helpful (non-retail) | Qualitative factors, with added conservatism |
| Payment behaviour | Helpful | Application data only |
| External ratings | Optional | Used as a benchmark |
Every choice is a decision for a person. Every test has its threshold on the page.
Each comes with a recommended option, the reason and any data gap. The model owner approves the set at the design gate.
- Model approachWhich modelling approach fits the data?
- Development sampleWhich observation years form the development sample?
- Hold-out sampleHow is the model tested on data it was not estimated on?
- Candidate driversWhich fields may the agents consider as risk drivers?
- Maximum number of driversHow many drivers may the final model contain?
- SegmentationOne model, or one per segment?
- Master scaleWhich master scale maps PDs to grades?
- Margin of conservatismAt what confidence level is the general estimation error (category C) quantified?
- PD input floorWhich PD floor applies to this portfolio?
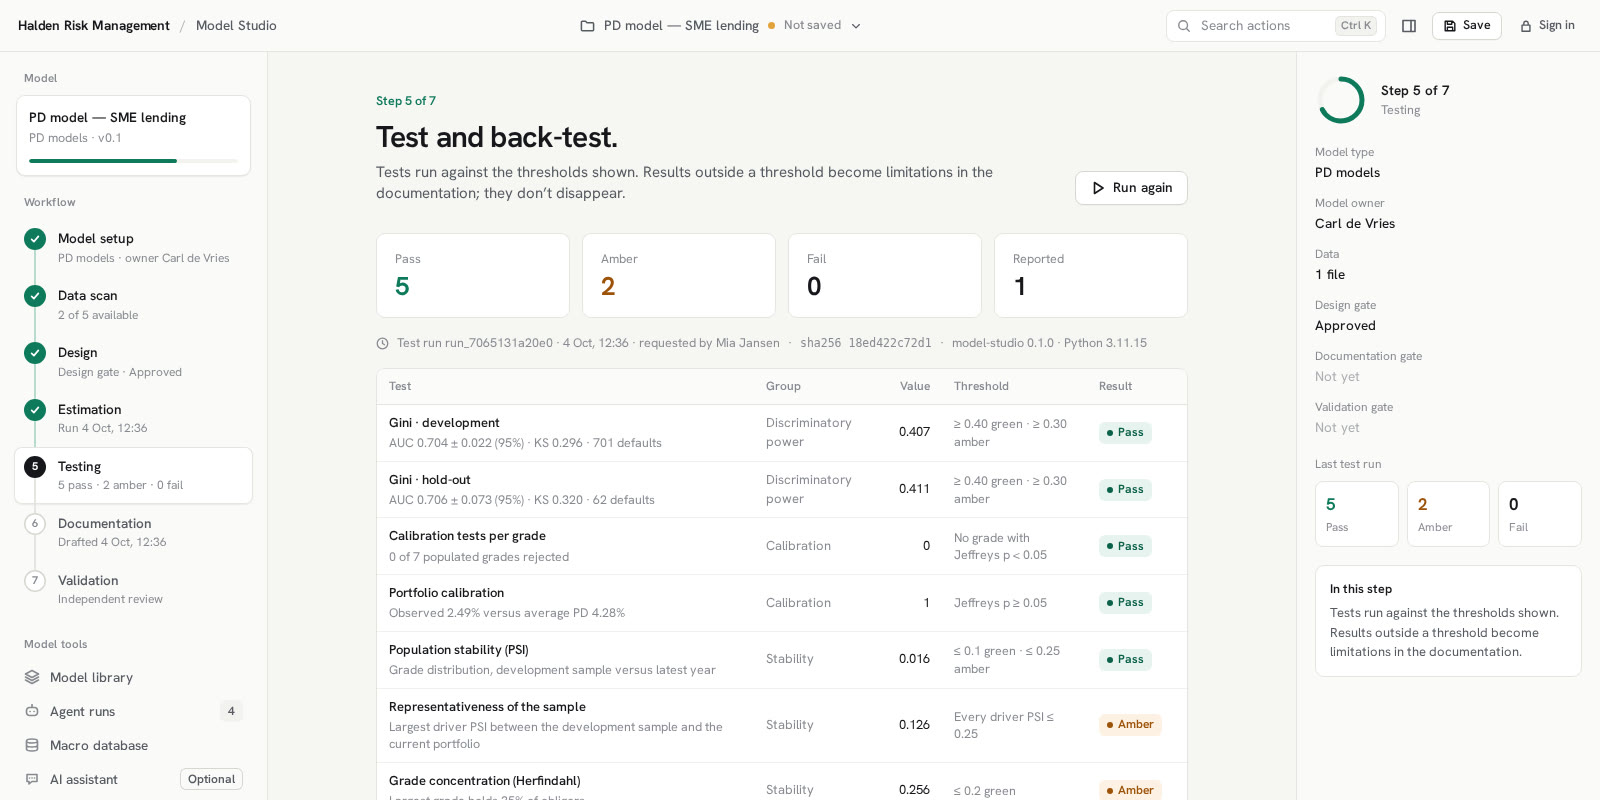
Shown next to each result. A test outside its threshold stays visible and becomes a limitation in the documentation.
| Test | Group | Threshold |
|---|---|---|
| Gini · development | Discriminatory power | ≥ 0.40 green · ≥ 0.30 amber |
| Gini · hold-out | Discriminatory power | ≥ 0.40 green · ≥ 0.30 amber |
| Calibration tests per grade | Calibration | No grade with Jeffreys p < 0.05 |
| Portfolio calibration | Calibration | Jeffreys p ≥ 0.05 |
| Population stability (PSI) | Stability | ≤ 0.1 green · ≤ 0.25 amber |
| Representativeness of the sample | Stability | Every driver PSI ≤ 0.25 |
| Grade concentration (Herfindahl) | Stability | ≤ 0.2 green |
| Override analysis | Use | Reported |
Building or rebuilding a PD model?
See it done on your data.
We'll walk through your use case and show the product on data structured like yours.